
Asia-Pacific rebound lifts global air cargo volumes 2%
Global air cargo volumes and rates rose in the third week of October, led by a rebound in Asia-Pacific exports following the Golden Week holiday.
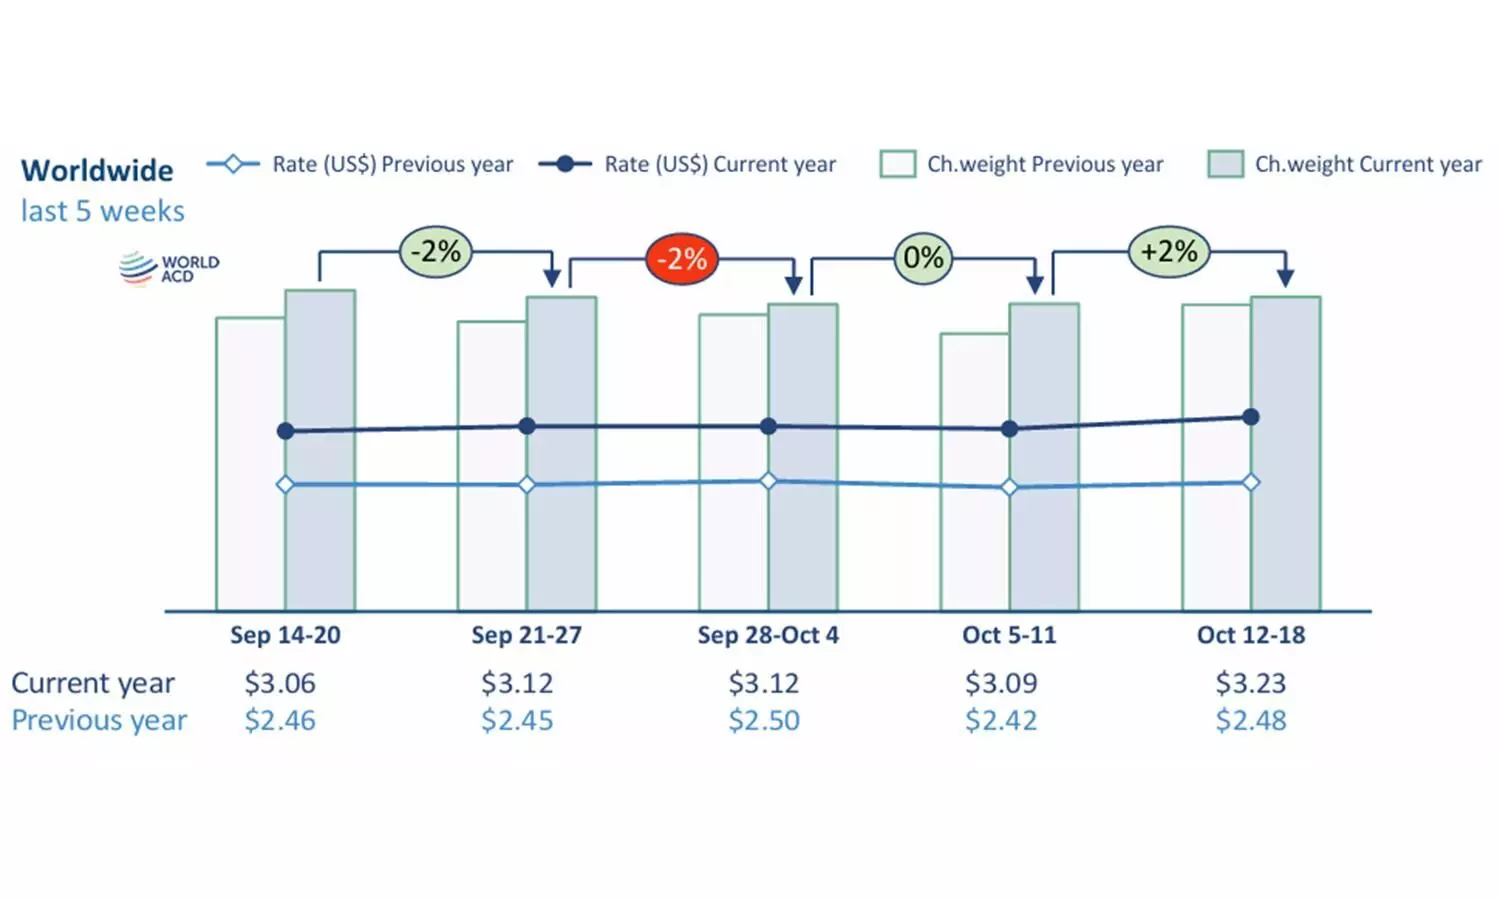
Global air cargo volumes rose 2% week-on-week in the third week of October, driven by a strong rebound in exports from Asia-Pacific as factories resumed operations following the Golden Week holiday period. According to WorldACD Market Data, global chargeable weight increased 2% in the week of 12–18 October 2026, while average air cargo rates rose 4% in US dollar terms. Capacity also expanded 2%, supported by a recovery in freighter deployment following two consecutive weeks of reductions.
Asia-Pacific recorded a 9% week-on-week increase in chargeable weight, offsetting declines across all other origin regions. North America saw the steepest contraction at 5%, partly attributed to Thanksgiving in Canada and Columbus Day/Indigenous Peoples’ Day in the US. Volumes also fell 4% in Central and South America, 3% in the Middle East and South Asia, 2% in Europe and 1% in Africa.
Despite the regional declines, global air cargo pricing increased across all origin regions except one, contributing to the overall 4% rise in rates.
Asia Pacific exports rebooted
Air cargo tonnage from Asia-Pacific to Europe and the US increased 13% and 10% week on week, respectively. Shipments to the US rose from nearly all major Asian origins, with Hong Kong recording a 27% increase and China 18%. Japan was the exception, with volumes stabilising following its post-Silver Week recovery. To Europe, South Korea led the rebound with a 34% increase, followed by China at 22%, Singapore at 16% and Hong Kong at 11%. However, volumes from Vietnam, Japan and Malaysia to Europe declined.
Compared with the same period last year, chargeable weight from Asia-Pacific to the US rose 14%, supported by growth across all origins except Hong Kong. The trend reflects continued demand for AI-related shipments across the Pacific. In contrast, cargo volumes from Asia-Pacific to Europe fell 16% year on year. Hong Kong recorded the steepest decline at 32%, amid European Union measures to curb e-commerce parcel imports. Shipments from China and Vietnam dropped 12% and 10%, respectively, while South Korea was the only origin to post double-digit annual growth to Europe, with volumes rising 14%.
Reduction in MESA traffic
Air cargo volumes from the Middle East and South Asia (MESA) declined week on week, falling 6% to Europe and 4% to the US, as shipments from several origins recorded double-digit decreases. Volumes to the US dropped by double-digit percentages from Dubai and Sri Lanka, while shipments from India declined 2%. To Europe, tonnage from Sri Lanka fell 15% and from India 7%, while volumes from Dubai increased 5%.
Year-on-year trends showed a sharp contrast between the two destination markets. Chargeable weight from MESA to the US rose 24%, driven by increases of 34% from India and 44% from Bangladesh. In comparison, volumes to Europe declined 13%, with shipments falling from all origins except Sri Lanka.
Capacity and rates on the rise
Global air cargo capacity rose 2% week on week in the third week of October, recovering from declines of 1% in each of the previous two weeks. The rebound was led by a 6% increase in capacity from Asia-Pacific following the resumption of exports after the Golden Week holiday. Capacity also grew 2% from Europe and 1% each from North America and Central and South America (CSA). In contrast, Africa and the Middle East and South Asia (MESA) recorded a 2% reduction.
Across weeks 41 and 42, global capacity was down 1% compared with the preceding two-week period but remained 2% higher than in the corresponding period in 2025.
Air cargo rates increased week on week across all origin regions except Africa, where prices fell 4%. Rates rose 4% from Asia-Pacific, 3% from CSA, 2% from MESA and 1% each from Europe and North America. On a two-week comparison, global pricing increased 1%, supported by gains of 1% to 3% from MESA, Europe and North America. Year on year, average global rates were nearly 30% higher. Prices rose 25% to 29% from Europe, Asia-Pacific, North America and Africa, while MESA recorded a 61% increase. CSA registered a more modest 7% rise.
On key Asia-Pacific trade lanes, rates to the US climbed 6% week on week, while those to Europe increased 1%. Singapore recorded the sharpest increase on the transpacific route, with rates to the US rising 23%. Prices from other Asian origins generally increased by single-digit percentages, while Indonesia remained unchanged. Rates to Europe also rose by single-digit percentages from most origins, with Thailand flat, Vietnam down 1% and Japan declining 8%.
Compared with the previous year, Asia-Pacific rates to the US were 41% higher, with increases of 34% to 48% across most trade lanes. Rates to Europe rose 25% on average, ranging from a 16% increase from Hong Kong to a 56% jump from Indonesia.
Strong demand for artificial intelligence-related shipments has fuelled expectations of a robust peak season on transpacific routes. However, the outlook for Asia-Pacific–Europe traffic remains uncertain ahead of the European Union's planned €2 handling fee on non-EU e-commerce imports from 1 November 2026. This will be in addition to the €3 customs duty per item, introduced on 1 July 2026 for low-value consignments worth up to €150.